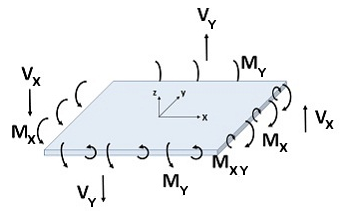
Plate boundaries are the primary elements modeled and analyzed in VisualPlate. Boundaries with a wide variety of shapes and sizes can be modeled in the program. The boundary can be supported by Point Supports and Line Support and stiffness can be added by modeling Line Stiffeners into the boundary. A single material is used for all boundaries in the project and is defined in the .
In the Model and Load view, circular, rectangular, polygonal, or custom boundaries can be drawn using the buttons in the ribbon. Boundaries are defined by the vertices at boundary points. New boundaries can be drawn on grids or existing vertices and snap points can be used to create the boundary. The number of snap points along each edge of the boundary is specified in the in the tab. Any arbitrary geometry can be constructed by drawing multiple boundaries connected to or overlapping each other. Adjoining boundaries are modeled as continuous, with common displacements and flexural rotations at the boundaries. Each individual boundary can have a different thickness. At locations of overlapping boundaries, the thickness is specified using the Thickness Overlap parameter in the tab. Note: Disconnected boundaries are not allowed in VisualPlate and expansion-joints or other discontinuities cannot be modeled.
A selected boundary can be turned into a hole by setting Hole? = Yes in the tab. Loads that exist within holes are not included in the analysis. If portions of Area Loads lie partially over holes, only the loading lying over boundaries are considered (i.e. the loading that occurs over holes is not distributed to adjacent plate elements)
Boundaries may be loaded with Full Area, Circular, Rectangular, Tubular, and Ring area loads or by concentrated Point loads. Loads can also be transferred to the slab by Line Stiffeners.
Finite element analysis is approximate and numerical. Use mesh refinement and examine results carefully, before trusting analysis results.
Boundaries in VisualPlate are meshed into triangular FEA plate elements. See the Analysis page for more information on the FEA mesh density, including the available settings and options. For a better understanding of the FEA model that is built by VisualPlate, use the feature to create a VisualAnalysis project and examine the FEA model in more detail. More information on integration between VisualPlate and other IES tools can be found on the Integration page of the Help File.

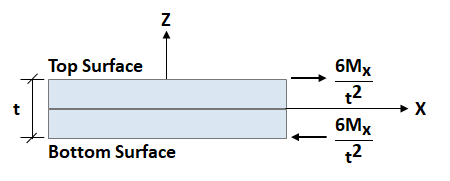
Plates are only subject to bending stresses in VisualPlate. Therefore, the mid-plane is the neutral axis and the normal stresses at this plane are zero. The stresses at the top and bottom surfaces are equal in magnitude and opposite in sign.

The results from the finite element analysis can be displayed graphically in the Analysis Results view. The tab displays the numerical results that correspond to the colored graphics. With nothing selected, the results displayed in the are a summary for the selected result case, whereas if one or more individual plates are selected, the shows the result range for the selected plates. The various Result Cases that were included in the finite element analysis can be selected using the Result Case drop down from the tab. The Result Type displayed graphically in the Analysis Result view is specified in the .
Plate result moment, shear, and displacement diagrams are available in the Analysis Results view. Left-click and drag a line across the slab to view the result at the line's location or right-click and select Show Plate Result Diagram from the context menu to view the diagrams for the selected result case. The slice direction and location can be adjusted within the Plate Result Diagrams dialog box along with the number of plots displayed and the plot type. Note: The result location and plot settings will persist within one session of VisualPlate. This allows the Plate Result Diagrams dialog box to be closed to select a different result case or to modify the model without losing the adjustments that were made in the dialog.
Analysis results can also be viewed in text form using the Text Reports tab. Once on the Text Report tab, a list of available tables is shown on the tab and can be added to the text report by double-clicking an individual table or dragging and dropping a table into the report. Plates can also be reported on an individual basis by selecting one or more plates from the Analysis Results view, and using the right-click context menu to Report Selected.