In ConcreteSection, the interaction surface is determined using equilibrium, strain compatibility, and the constitutive models for both concrete and steel as discussed in the Analysis section of the help file. The more refined approach that ConcreteSection uses to calculate capacities will produce results that vary slightly from approximate methods that use a rectangular Whitney stress block.
Five different tabs are used to view the interaction surface and diagrams in ConcreteSection:
These diagrams show the capacity of the reinforced concrete section including the Strength Reduction Factors (f) when applied. When factored loading exists, the loads can be viewed as points on the diagrams. The MX and MY diagrams show vertical cuts through the interaction surface, whereas the Moment Unity and Flexure diagrams show horizontal cuts through the interaction surface.
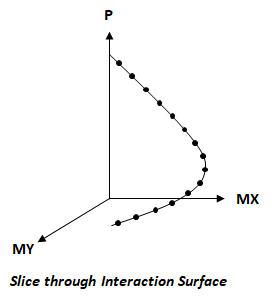
For a given value of axial force P and bending moment resultant (MX, MY) a single point is plotted on an interaction surface. For a given ratio of MX/MY ConcreteSection calculates a series of points which are viewed as a single slice though the interaction surface (shown in the image below). The number of interaction points used in the slice can be set in the . The number of slices in each quadrant can also be set in the (all 4 quadrants of the surface will have the same number of slices). The definition of the interaction surface increases as the number of interaction points and quadrant slices are increased. The points on the surface of the non-factored interaction surface are calculated assuming the maximum concrete strain is at eo. Note: The interaction surface does not take into account the effects of slenderness for concrete columns.

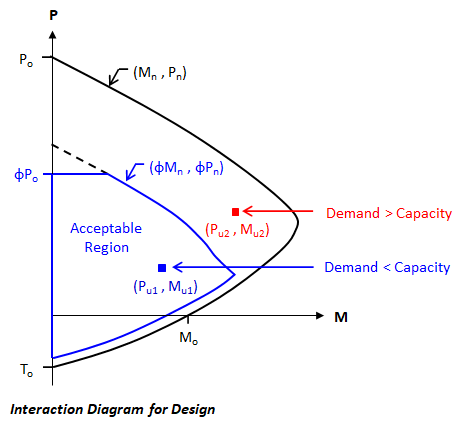
In Concrete Section, the Strength Reduction parameter and the transverse reinforcement type can be set in the tab. Setting the Strength Reduction parameter to ACI 318-19 or CSA A23.3:19 applies both the strength reduction factors and the maximum axial compressive strength limit to the interaction surface per the chosen design specifications. The image below shows how an interaction diagram (i.e. a cut through the surface) is reduced when strength reduction factors are used in the program. For design, when the applied factored loads lie inside the factored interaction surface (Pu1, Mu1), the capacity exceeds the demand whereas when the applied factored loads lie outside the factored interaction surface (Pu2, Mu2) the demand exceeds the capacity. For convenience, ConcreteSection provides Moment Unity Values that identify where the factored loads fall in relation to the interaction surface.

The moment unity view shows the flexural capacity of the section at the factored axial load for a particular Result Case. This is simply a horizontal cut through the interaction surface located at the factored axial force. If the axial force exceeds the axial load only capacity (fPo) shown in the image above, this surface cannot be displayed. Also, the Moment Unity view is not active when there are no loads applied to the reinforced concrete section.
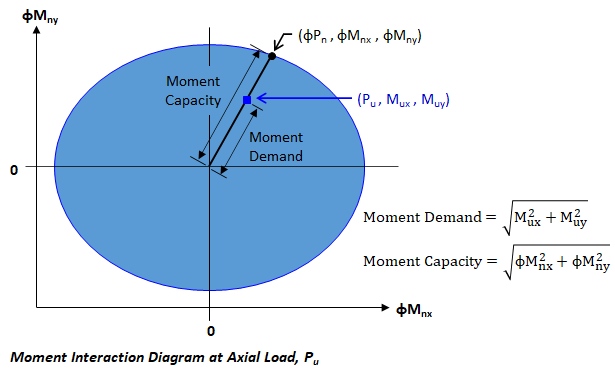
The moment unity view can be used to visualize how the Moment Unity Values are calculated. ConcreteBending calculates a design level Moment Unity value for each result case as:

where the Moment Demand is the distance from the center of the diagram to the load point and the Moment Capacity is the distance from the center to the edge of the unity diagram along the line used to calculate the Moment Demand. These values are shown in the figure below. Note: When Strength Reduction Factors are not used, the Moment Unity calculation is based on the non-factored interaction surface.
